Plotting
The generation of plots is done with ease via a plugin system. If a plot plugin exists, only a single configuration file is needed to generate the plots for such plugin. This quickstart will address how to use the existing plugins as well as how to start creating your own plugins.
Note
The configuration language was chosen to be python due to its simplicity and the fact that it is a full programming language. This allows for a lot of flexibility and the possibility to configure files in a very compact way (as opposed to YAML or JSON where you need to repeat a lot of information).
Learning about the existing plotting plugins
The builtin plugins are located in the plugins directory in the root of the project. The plugins are can be inspected
by looking at the main.py file in each plugin directory. Alternatively, you can use the vdmplot cli
tool to get a description of what the plot accepts as input. For example, running the following command:
$ vdmplot describe-strategy DetectorRatio
should give you the following output:
[    INFO vdmtools.cli ]
VdMTools 0.1.1 COMMAND LINE INTERFACE

Program: run
=============================================

[    INFO vdmtools.cli.plotting.describe_strategy ] No external plugins directory specified. Using internal plugins.
[    INFO vdmtools.cli.plotting.describe_strategy ] Loaded plugin DetectorRatio.
[    INFO vdmtools.cli.plotting.describe_strategy ] Strategy DetectorRatio from plugin DetectorRatio
[    INFO vdmtools.cli.plotting.describe_strategy ] Data description: The data for this plugin must be a ScanResults object.
[    INFO vdmtools.cli.plotting.describe_strategy ] Accepted arguments:
[    INFO vdmtools.cli.plotting.describe_strategy ] 	quantity: The name of the column to plot.
[    INFO vdmtools.cli.plotting.describe_strategy ] 	error: The name of the column to use as error.
[    INFO vdmtools.cli.plotting.describe_strategy ] 	latex: The latex representation of the quantity.
[    INFO vdmtools.cli.plotting.describe_strategy ] 	reference_detector: The detector to use as reference.
[    INFO vdmtools.cli.plotting.describe_strategy ] 	fit_status: The status of the fit to consider. See the ScanResults class for more info
[    INFO vdmtools.cli.plotting.describe_strategy ] 	cov_status: The status of the covariance matrix to consider. See the ScanResults class for more info
[    INFO vdmtools.cli.plotting.describe_strategy ] 	fmt: The format of the plot. For example, 'o' for circles.
[    INFO vdmtools.cli.plotting.describe_strategy ] 	colors: The colors (plt compatible) of the data points.
[    INFO vdmtools.cli.plotting.describe_strategy ] 	work_status: The work status label to use.
[    INFO vdmtools.cli.plotting.describe_strategy ] 	file_suffix: The suffix that will be appended to the name of the plot file
[    INFO vdmtools.cli.plotting.describe_strategy ] 	output_folder: The path to the folder that the plot will be saved in
[    INFO vdmtools.cli.plotting.describe_strategy ] 	save_pickle: Whether or not to save the plot as a pickle file
[    INFO vdmtools.cli.plotting.describe_strategy ] Reserved context keys:
[    INFO vdmtools.cli ]
=============================================
Program: run

VdMTools 0.1.1 COMMAND LINE INTERFACE
Using an existing plugin
As stated above, the bridge between the plugins and the plotting subpackage is done via a configuration file. As an examle, let us consider the plugin NormalAllDetectors present in the plugins folder in the root directory of the project.
Inspecting the main.py file in the directory, we can see the classe NormalAllDetectors.
A configuration file that uses the NormalAllDetectors class would look like this:
from pathlib import Path #  All Paths should be Path objects not strings
from vdmtools.io import read_one_or_many #  Utility to read one or many files into ScanResults

#  A required variable in all configuration files
#  Holds the names of the plugins to load. In this case, only the 'NormalAllDetectors' plugin
plugins = ["NormalAllDetectors"]

#  A required variable in all configuration files
#  A list of dictionaries. Each dictionary represents a type of plot to be generated
plots = [
    {
        "strategy_name": "NormalAllDetectors",
        "strategy_args": {
            "quantity": "CapSigma_X",
            "error": "CapSigmaErr_X",
            "latex": r"$\Sigma_X$", #  The latex representation of the quantity
            "output_folder": Path("8999_VdM1_plots"), #  Where to save the plots
            "file_suffix": "_CapSigma_X", #  The suffix to add to the file name
        },
        "context": None, #  The context to use. In this case, None means empty context
        "data": read_one_or_many( #  Let's read the data in the specified folder.
            Path("../data/8999_no_corr/analysed_data/8999_28Jun23_230143_28Jun23_232943"),
            "VdM1", #  The scan name
            fits={"DG"} #  The fits to read. In this case, only the DG fit
        )
    },
]
See also
For more information see the documentation on the read_one_or_many() function.
Once the configuration file is ready, we can generate the plots by running the builtin cli tool vdmplot by providing it with the path to the configuration file as well as the path to the plugins directory where the plugin we want to use is located.
$ vdmplot config.py plugins/
The vdmtools will keep you updated on the progress of the plot generation and will let you know when it is done.
Once the plots are generated, they will be saved in the folder specified in the configuration file with a easy to follow folder structure. For the example above, these are some of the plots that are generated:
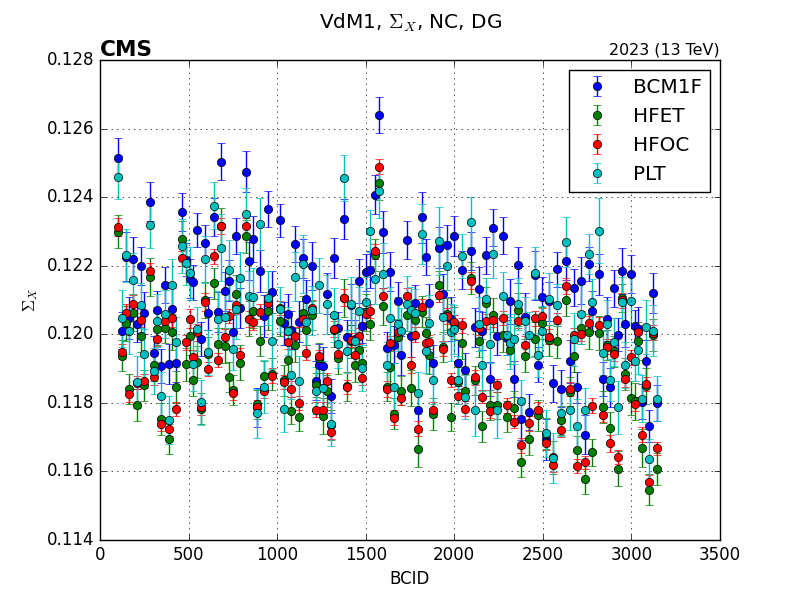
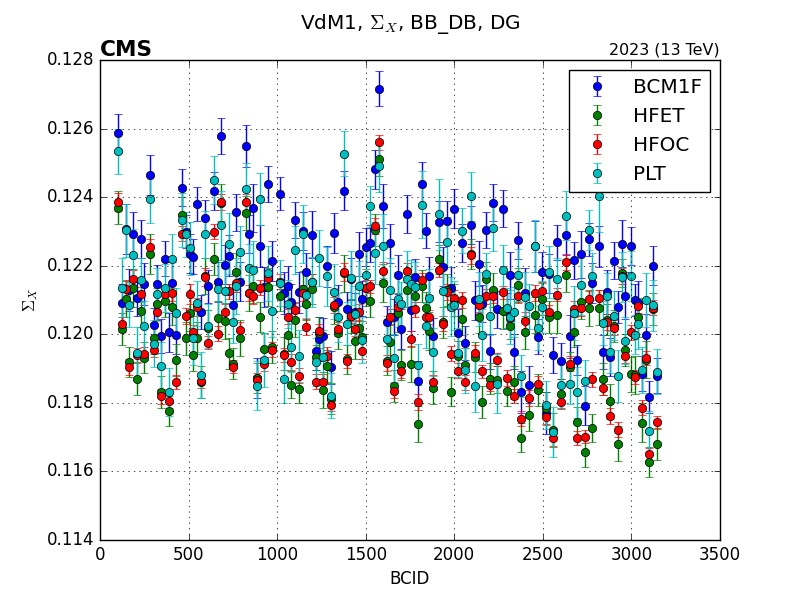
Note
BCM1FUTCA is missing from the plots because it is not present in the path I provided.
Next follows a configuration file that uses the the EvolutionAllDetectors plugin:
from pathlib import Path #  All Paths should be Path objects not strings
from vdmtools.io import read_one_or_many #  Utility to read one or many files into ScanResults

import numpy as np

#  Creating a custom statistics function
#  This gives the user the control to define how the statistics are calculated
#  In this case, we are using the weighted average and RMS
def statistics(values, errors, context):
    weights = errors ** -2
    avg = np.average(values, weights=weights)
    err = np.sqrt(np.average((values - avg) ** 2, weights=weights))
    return avg, err

#  A required variable in all configuration files
#  Holds the names of the plugins to load. In this case, only the 'EvolutionAllDetectors' plugin
plugins = ["EvolutionAllDetectors"]

#  A required variable in all configuration files
#  A list of dictionaries. Each dictionary represents a type of plot to be generated
plots = [
    {
        "strategy_name": "EvolutionAllDetectors",
        "strategy_args": {
            "quantity": "CapSigma_X",
            "error": "CapSigma_X",
            "latex": r"$\Sigma_X$", #  The latex representation of the quantity
            "output_folder": Path("8999_Fill_plots"), #  Where to save the plots
            "file_suffix": "_CapSigma_X", #  The suffix to add to the file name
            "stats_function": statistics, #  The custom statistics function
        },
        "context": None, #  The context to use. In this case, None means empty context
        "data": read_one_or_many( #  Utilising the glob method of Path objects to read all the scans in the folder
            Path("../data/8999_no_corr/analysed_data/").glob("8999*"),
            ["VdM1", "BI1", "BI2", "VdM2", "VdM3", "VdM4", "VdM5", "VdM6"], # The names of the scans in the order they happened
            fits={"DG"} #  The fits to read. In this case, only the DG fit
        )
    },
]
Important
There are a few things to note in this configuration file:
First, notice how little the configuration file changed. Using a different plugin ia as easy as changing the name of the plugin in the
pluginsvariable and changing the name of the strategy in thestrategy_namevariable.Second, notice how we are using the
read_one_or_many()function to read all the scans in a folder. This utility functions , as the name suggests, supports reading a single results folder or many.Third, notice how we are using a custom statistics function to calculate the statistics of the quantity in whatever way we want. This is done by passing the function to the
stats_functionargument of the plugin.
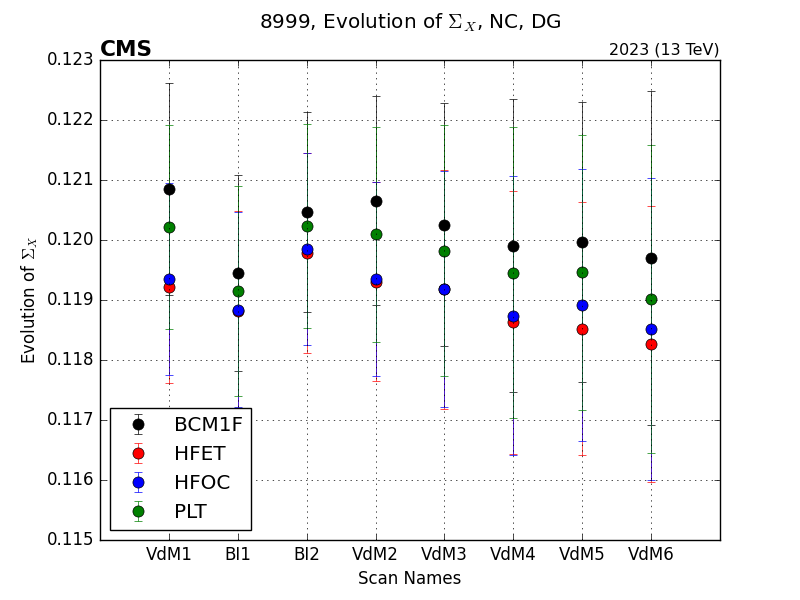
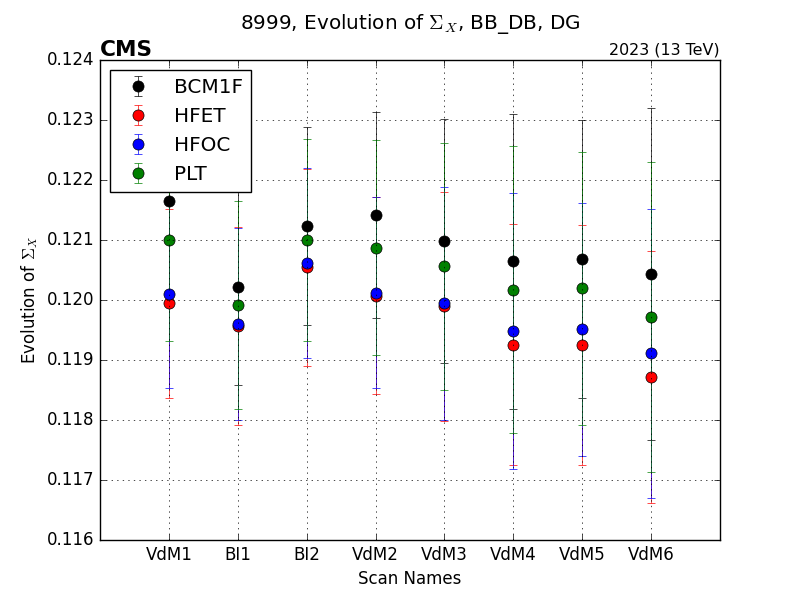
Running the vdmplot cli again on this configuration file will generate plots of the following form:
Creating a new plugin
It may be the case that the plot you want is not present in the existing plugins. In this case, you can create your own plugin and use it in the same way as the builtin plugins.
The bes way to create a new plugin is to use the vdmplugin cli tool. This tool manages all thins related to plugins. We can use it to create a new plugin by running the following command:
$ vdmplugin create
Upon running this command, the creation of the plugin will take place in an interactive manner. The tool will ask you the name of the plugin, the description amongst other things. After going through the interactive process, go to the location you specified and you will find a folder containing the folloing:
A python file (by default named main.py) where you will write the code for the plugin. There will be a template class in the file that you can use as a starting point.
A JSON file that contains the metadata of the plugin.
Creating the plugin now requires some understanding on how the children of IStrategyPlugin interact with the
VdMPlotter. For a full example, please refer to the Example Implementation section in the VdM Plotting Inner Workings.
Adding a new plugin to the builtin plugins
Important
The addition of new plugins to the builtin plugins should be done with caution. You should only add a plugin to the builtin plugins after making sure that it is well tested and documented.
If you want to add your plugin to the builtin plugins, you can do so by creating simply copying the plugin folder to the plugins
directory in the root of the project.
Note
Only copy the folder of the plugin you want to add. Do not copy the whole plugins directory.
After, create a pull request to the master branch of the project and wait for it to be reviewed and merged.